
The Coffee Brewing Control Chart is a standardized graphical tool used in the science and practice of coffee extraction to visually represent the relationship between coffee strength (measured as total dissolved solids, or TDS) and extraction yield (expressed as a percentage of soluble compounds removed from ground coffee).
The chart functions as a diagnostic and prescriptive instrument, enabling coffee professionals, researchers, and informed enthusiasts to evaluate the quality of a brewed cup and to adjust brewing variables accordingly. It is widely regarded as one of the foundational frameworks in specialty coffee science.
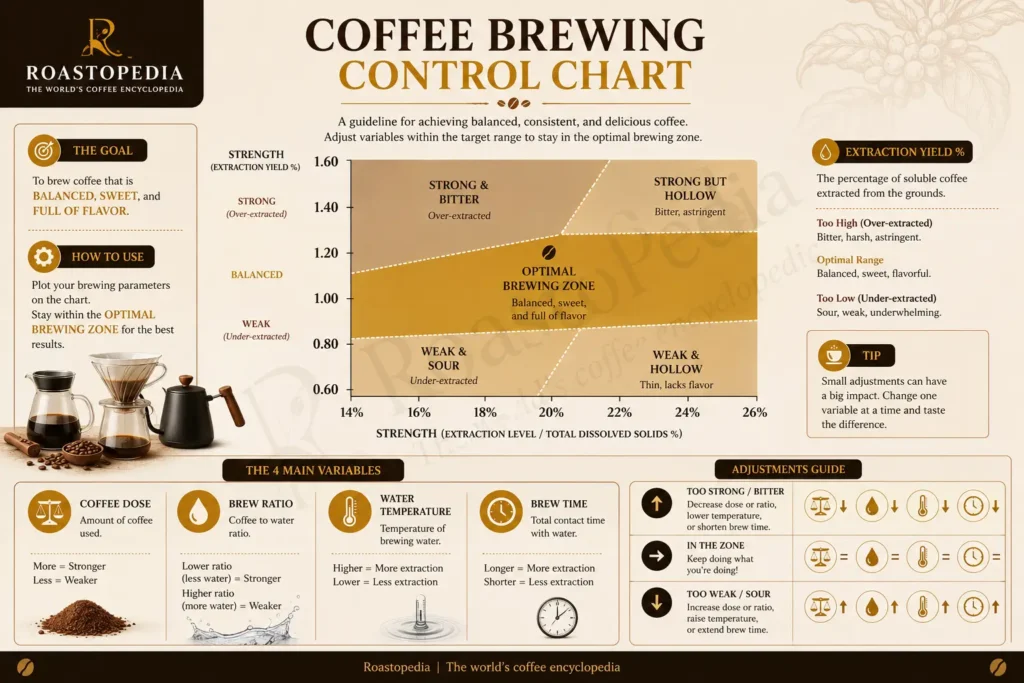
The chart plots two axes: the vertical axis represents beverage strength or total dissolved solids (TDS, typically expressed in percentage or grams per liter), and the horizontal axis represents extraction yield (the percentage of solubles extracted from the dry coffee grounds).
Within this coordinate space, a bounded region — commonly referred to as the “ideal” or “target” brewing zone — demarcates the range of strength and extraction combinations that most trained tasters have historically associated with optimal sensory quality. Coffee brewed outside this zone is generally characterized as either under-extracted (sour, thin, or grassy), over-extracted (bitter, harsh, or astringent), too weak (watery or lacking body), or too strong (dense, heavy, or overpowering).
The chart also incorporates a third variable — the brew ratio (the ratio of ground coffee to water) — represented as diagonal lines traversing the graph, allowing the user to visualize how the ratio relates to the strength and extraction outcome.
Because these three variables (TDS, extraction yield, and brew ratio) are mathematically interrelated, any two known values allow the third to be calculated, and the chart makes this relationship visually accessible without requiring complex arithmetic in the field.
Definition
The Coffee Brewing Control Chart is formally defined as a two-dimensional graph on which:
- The x-axis represents extraction yield, expressed as a percentage, calculated by dividing the mass of dissolved solids in the beverage by the mass of the dry coffee used: Extraction Yield (%) = (Beverage Weight × TDS) ÷ Dose.
- The y-axis represents beverage strength, expressed as Total Dissolved Solids (TDS), typically as a percentage by weight or in grams per liter, measured using a refractometer.
- Diagonal lines represent constant brew ratios (grams of coffee per gram or liter of water), illustrating how a fixed ratio maps across a range of extraction and strength outcomes.
- A central target zone (also called the “ideal brewing corridor” or “optimum zone”) marks the range of TDS and extraction values generally associated with balanced sensory quality as defined by consensus-based cupping and consumer research.
The chart does not represent an absolute standard of taste; rather, it provides a shared empirical reference framework. Actual preferences vary by consumer culture, brewing method, and roast profile, and the target zone itself has been revised multiple times since the chart’s inception.
Origin and Historical Development
Early Foundations (1950s–1960s)
The intellectual groundwork for the Coffee Brewing Control Chart was laid in the United States during the 1950s by Ernest Earl Lockhart, a chemist working under the auspices of the Coffee Brewing Center — a research division established in 1952 by the Pan-American Coffee Bureau in New York City.
Lockhart and his colleagues conducted systematic consumer taste preference studies in which large panels of American coffee drinkers evaluated brewed coffee samples spanning a wide range of strength and extraction levels.
From this research, Lockhart derived empirical ranges for both TDS and extraction yield that corresponded to the highest preference scores among American consumers. These ranges were published in a 1957 report titled “The Soluble Solids in Beverage Coffee as an Index to Cup Quality”, in which Lockhart proposed that optimum American coffee strength fell between approximately 1.15% and 1.35% TDS, and that optimum extraction yield fell between approximately 18% and 22% of solubles from the dry grounds.
Lockhart’s data were subsequently translated into graphical form — the first recognizable iteration of the Brewing Control Chart — and distributed as an educational tool through the Coffee Brewing Center’s outreach programs to the American food service industry. The chart was intended to help institutional coffee brewers (hotels, diners, hospitals) achieve consistent quality through measurement rather than intuition.
Adoption and Refinement by the SCAA (1980s–2000s)
Following the closure of the Coffee Brewing Center in the early 1970s, the chart’s methodology was largely dormant in mainstream American coffee practice until its revival and institutionalization by the Specialty Coffee Association of America (SCAA) beginning in the 1980s. The SCAA adopted Lockhart’s empirical ranges and integrated the Brewing Control Chart into its brewing standards, training curricula, and the development of the SCAA Golden Cup Standard.
The SCAA’s version of the chart was adapted for specialty coffee contexts and incorporated into the evaluation criteria used in its Certified Brewing Equipment Program. Equipment manufacturers wishing to receive SCAA certification were required to demonstrate that their brewers could consistently produce coffee falling within the target zone. This institutional adoption significantly elevated the chart’s profile within the specialty coffee industry.
During this period, the chart was further developed and popularized by Ted Lingle, the longtime executive director of the SCAA, whose manual “The Coffee Brewing Handbook” (1996) became a standard industry reference. Lingle’s presentation formalized the graphical layout still in widespread use today and articulated the relationships among brewing variables with greater precision than Lockhart’s original papers.
International Adoption and the SCA Era (2000s–Present)
As specialty coffee expanded globally in the 2000s, parallel standards bodies in Europe — most notably the European Coffee Brewing Centre (ECBC) in Scandinavia — conducted their own consumer preference research and developed their own brewing control parameters. While largely consistent with Lockhart’s findings, the European standards reflected slightly different consumer preferences, particularly with respect to beverage strength, with some European standards favoring a slightly higher TDS range.
In 2017, the SCAA merged with the Specialty Coffee Association of Europe (SCAE) to form the unified Specialty Coffee Association (SCA). The SCA subsequently undertook a reassessment of its brewing standards, including the target zone parameters on the Brewing Control Chart, incorporating updated research, broader consumer data, and input from diverse global coffee cultures. The SCA’s revised brewing standards document, released in conjunction with its updated Water Quality Handbook and brewing protocols, reflects a more nuanced and regionally calibrated approach to the ideal brewing corridor than its predecessors.
How the Chart Works
Calculating the Variables
The three core variables — TDS, extraction yield, and brew ratio — are bound by the following mathematical relationship:
Extraction Yield (%) = (Brewed Coffee Weight in grams × TDS%) ÷ Dose (grams of dry coffee)
To use the chart in practice:
- A brewer measures the dose (mass of dry ground coffee used).
- A brewer measures the brew weight (mass of the finished brewed beverage).
- A digital refractometer (see Refractometry) calibrated for coffee is used to measure the TDS of the cooled brewed coffee.
- Extraction yield is calculated using the formula above, or derived directly from the chart by locating the intersection of the measured TDS and the appropriate brew ratio line.
The Target Zone
The target zone on the SCA’s current chart is defined as follows (as of updated post-2019 standards):
- TDS range: approximately 1.15% to 1.45% (expressed as percent by weight)
- Extraction yield range: approximately 18% to 22%
Coffee whose TDS and extraction values place it within this zone is considered to be in the “ideal” range. Coffee plotting to the left of the zone (low extraction, any strength) is described as under-extracted; coffee to the right (high extraction) is over-extracted. Coffee above the zone (excessive TDS) is deemed too strong; coffee below is too weak.
These boundaries are not absolute maxima or minima of sensory quality; they represent statistical consensus ranges from consumer preference research. Individual coffee professionals frequently work outside the standard zone deliberately, particularly with light roasts or specific single-origin coffees where higher extraction yields may be appropriate.
Brew Ratio Lines
The diagonal lines crossing the chart represent constant brew ratios — the proportion of coffee to water used. Common ratios represented include 1:15, 1:16, 1:17, 1:18, and 1:20 (coffee to water by mass). A brewer working at a fixed ratio and wishing to move within the target zone must adjust grind size, water temperature, or brew time — the key extraction variables — rather than the ratio itself.
Brewing Variables and Their Relationship to the Chart
The Brewing Control Chart does not prescribe specific brewing parameters; it maps the outcome of brewing. The following variables influence where a brew plots on the chart:
- Grind size: Finer grinding increases extraction yield by exposing more surface area to water; coarser grinding decreases it.
- Water temperature: Higher temperatures increase extraction rates and yield; lower temperatures decrease them.
- Contact Time (Brew time): Longer contact time increases extraction; shorter time decreases it.
- Water quality: Mineral content affects extraction efficiency; soft water typically under-extracts, while moderately mineralized water facilitates more complete extraction.
- Agitation and turbulence: Stirring or controlled turbulence during brewing can increase extraction uniformity and yield.
- Roast level: Lighter roasts generally require higher extraction yields (often 20–24%) to achieve balanced flavor, while darker roasts become unpleasant at similar yields due to the accelerated degradation of desirable compounds.
- Dose and brew ratio: The coffee-to-water ratio directly determines TDS for a given extraction yield, and is represented graphically as the diagonal lines on the chart.
Variations of the Chart Across Brewing Methods
The Brewing Control Chart was originally developed for batch-brewed drip coffee as commonly prepared in the American institutional food service context. Its application to other brewing methods requires methodological adaptation:
Espresso
Espresso brewing produces TDS values dramatically higher than filter coffee — typically between 8% and 12% TDS — and involves extraction yields between 18% and 22% (with some practitioners extending to 24%). A separate Espresso Brewing Control Chart has been developed within specialty coffee education to account for these parameters. The ratio lines in espresso charts reflect the brew ratio (commonly referred to as the “recipe ratio” or “yield ratio”), typically ranging from 1:1.5 to 1:3 (dose to liquid espresso weight). The SCA, the World Barista Championship (WBC), and associated training bodies use adapted versions of the chart for espresso evaluation.
Cold Brew
Cold brew coffee, produced by steeping coarsely ground coffee in cold or room-temperature water for an extended period (typically 12–24 hours), typically produces a concentrate with TDS ranging from 2% to 6% prior to dilution. Applying the standard Brewing Control Chart to cold brew without modification is considered inappropriate by most practitioners, as the sensory profile of cold brew differs substantially from hot-brewed coffee at equivalent TDS and extraction values. Adaptation of the chart for cold brew purposes has been discussed in specialty coffee literature but has not been standardized as of the early 2020s.
Pour-Over and Manual Methods
For pour-over methods (including V60, Chemex, Kalita Wave, and similar), the standard SCA chart is applicable, though practitioners frequently target extraction yields at or slightly above the upper boundary of the standard ideal zone (up to 23–24%) owing to the precision of manual brewing and the preference among specialty coffee professionals for light roasts, which benefit from higher extraction. Grind size and pouring technique are the primary variables adjusted in response to chart feedback.
Immersion Methods (French Press, AeroPress)
Immersion brewing such as French Press and AeroPress, where grounds remain in contact with water for the full duration of extraction, produces somewhat different extraction dynamics than percolation methods. TDS and extraction yield can still be measured and plotted on the standard chart, though practitioners note that immersion brewing at equivalent extraction percentages may produce different sensory qualities than percolation brewing due to differences in fines migration, emulsification, and sediment content.
Turkish Coffee
Turkish coffee, brewed by simmering finely ground coffee in water without filtration, produces unfiltered beverages with suspended solids that cannot be accurately measured by optical refractometry. Application of the standard Brewing Control Chart to Turkish coffee is generally considered inapplicable, as the chart’s TDS measurement methodology assumes filtered or near-filtered liquid.
Implementation in Professional and Educational Contexts
Specialty Coffee Training
The Brewing Control Chart is a foundational component of the SCA Coffee Skills Program, the globally recognized modular training and certification system for coffee professionals. Within the Brewing module of this curriculum, students are required to demonstrate the ability to brew to a target on the chart, measure TDS using a refractometer, calculate extraction yield, and adjust brewing variables to correct deviations from the ideal zone. The chart similarly appears in curriculum developed by the Barista Guild and in the training materials of numerous national specialty coffee associations worldwide.
Equipment Certification
The SCA administers a Certified Home Brewer and Certified Commercial Brewer program, through which drip coffee brewing equipment is tested for its ability to consistently produce brewed coffee within the target zone under standardized conditions. Manufacturers whose equipment meets this standard are permitted to display the SCA certification mark. Certification testing protocols specify water temperature at the brewing head, brew time, and the resulting TDS and extraction of the finished beverage.
Quality Control in Roasting and Production
Coffee roasters and wholesale coffee suppliers use the Brewing Control Chart as a quality control tool to ensure that their coffees brew predictably within the target zone under standard conditions. Brew protocols are often provided on coffee packaging or wholesale order sheets specifying a recommended dose, brew ratio, and grind setting, with the expectation that a correctly calibrated brewer will produce a coffee falling within the target zone.
Competition Contexts
In the SCA Brewers Cup Championship — a competition for manual brewing — competitors are evaluated on sensory quality rather than chart compliance, but preparation for competition typically involves systematic use of the Brewing Control Chart to develop and refine a recipe prior to competition. Competitors measure TDS and calculate extraction yield during practice to ensure their recipes are internally consistent.
Adaptations in Contemporary Specialty Coffee
Dialing in Light Roasts
A recognized adaptation of the Brewing Control Chart in contemporary specialty coffee practice involves adjusting the target zone parameters for light-roasted coffees. Because light roasts are denser and more soluble at higher extraction ranges, many practitioners — most notably those associated with the Nordic roasting movement and Scandinavian specialty coffee culture — routinely target extraction yields of 22–26% for light roasts, values that fall outside the traditional SCA ideal zone. This practice is supported by independent sensory research, including work published by researchers affiliated with the Norwegian Coffee Association and by Dr. Samo Smrke and colleagues at the Zurich University of Applied Sciences (ZHAW).
The Rao/Perger Contribution
Coffee researcher and educator Scott Rao and World Barista Champion Matt Perger have both contributed significantly to the popularization and reinterpretation of brewing chart principles in the 2010s. Rao’s book “The Coffee Brewing Handbook” (2011) expanded on Lingle’s work, and his advocacy for higher extraction yields in light-roast specialty coffee influenced the trajectory of the specialty coffee industry’s relationship with the chart. Perger’s development of the Barista Hustle Brew Ratio Calculator and related educational tools extended the chart’s accessibility to a broader, digitally connected audience.
Digital and App-Based Tools
As of the early 2020s, numerous digital applications and online calculators have been developed to replicate and extend the functionality of the printed Brewing Control Chart. These tools allow users to input dose, brew weight, and TDS values and receive instant extraction yield calculations, often with visual feedback and recipe logging features. The proliferation of consumer-grade refractometers (such as those produced by VST Inc. and Atago) has made real-time chart-based brewing evaluation accessible to home brewers, not only professional baristas.
Criticism and Limitations
Cultural Bias of the Baseline Research
The most frequently cited criticism of the Coffee Brewing Control Chart concerns the cultural specificity of Lockhart’s foundational consumer preference research. The 1950s studies were conducted with panels of American consumers whose palates had been formed by predominantly commercially roasted, commodity-grade coffee.
Critics — including specialty coffee researchers and writers such as Scott Rao and James Hoffmann — have argued that the ideal zone derived from this research does not adequately represent the preferences of specialty coffee consumers in the early 21st century, nor those of coffee-drinking cultures in Ethiopia, Japan, Scandinavia, Turkey, or the broader Arab world. The target zone, on this view, reflects historical American preference rather than a universal optimum.
Refractometry Limitations
The standard method of measuring TDS for chart-based brewing evaluation relies on optical refractometry, a technique that measures the refractive index of a solution as a proxy for dissolved solids concentration. Refractometry does not directly measure coffee TDS; rather, it measures a property correlated with TDS under specific conditions. Variables including roast level, brew temperature at the time of measurement, and the chemical composition of specific coffee compounds can introduce measurement error.
Research published in the Journal of Agricultural and Food Chemistry and related publications has identified conditions under which refractometric TDS readings may be unreliable, and practitioners are advised to standardize sample preparation (including cooling to a fixed temperature) to minimize error.
The Multidimensionality of Coffee Quality
The Brewing Control Chart reduces the multidimensional sensory experience of coffee to two quantitative variables (TDS and extraction yield). Critics note that two coffees with identical chart positions may taste substantially different due to differences in origin, variety, processing, roast profile, water mineral composition, grind distribution, and brewing method. The chart, therefore, is regarded by many practitioners as a diagnostic tool for identifying gross brewing errors rather than a comprehensive model of coffee quality. Sensory evaluation by trained tasters remains the ultimate arbiter of cup quality in specialty coffee.
Oversimplification in Consumer Education
Some coffee educators have expressed concern that the Brewing Control Chart, when presented without adequate context, may lead consumers or beginning practitioners to believe that brewing within the ideal zone guarantees a high-quality cup, or that brewing outside it necessarily produces an inferior one. This oversimplification has been identified as potentially counterproductive in educational settings, particularly when applied to brewing methods or coffee types for which the chart’s parameters were not originally designed.
See Also
- Extraction Yield
- Total Dissolved Solids (TDS)
- Refractometry in Coffee
- Golden Cup Standard
- Under-Extraction
- Over-Extraction
References
- Lockhart, E. E. (1957). The Soluble Solids in Beverage Coffee as an Index to Cup Quality. Coffee Brewing Center, Pan-American Coffee Bureau, New York.
- Lingle, T. R. (1996). The Coffee Brewing Handbook: A Systematic Guide to Coffee Preparation. Specialty Coffee Association of America, Long Beach, CA.
- Speciality Coffee Association of America (2009). SCAA Brewing Standards and Procedures. SCAA, Long Beach, CA.
- Specialty Coffee Association (2019). SCA Water Quality Handbook. SCA, Santa Ana, CA.
- Rao, S. (2011). The Coffee Brewing Handbook. Scott Rao, self-published.
- Smrke, S., Opitz, S. E. W., Vovk, I., & Yeretzian, C. (2018). “Titrimetric determination of chlorogenic acids and their lactones in coffee brews.” Journal of Agricultural and Food Chemistry, 66(43), 11244–11252. https://doi.org/10.1021/acs.jafc.8b04030
- Batali, M. E., Ristenpart, W. D., & Guinard, J.-X. (2020). “Brew temperature, at fixed brewing parameters, has little impact on the sensory profile of drip brew coffee.” Scientific Reports, 10, 16450. https://doi.org/10.1038/s41598-020-73341-4
- Frost, S. C., Ristenpart, W. D., & Guinard, J.-X. (2020). “Effects of brew strength and grind size on the quality of drip brewed coffee.” Journal of Food Science, 85(8), 2587–2600.
- Corrochano, B. R., Gebhardt, R., & Bentley, P. J. (2015). “A new methodology to estimate the steady-state permeability of roast and ground coffee in packed beds.” Journal of Food Engineering, 150, 106–116.
- Specialty Coffee Association (2020). Brewing Best Practices. SCA Education Resources, Santa Ana, CA.
- Perger, M. (2015). Barista Hustle: Understanding Extraction. Barista Hustle. https://www.baristahustle.com/blog/understanding-extraction/
- Hendon, C. H., Colonna-Dashwood, L., & Colonna-Dashwood, M. (2014). “The Role of Dissolved Cations in Coffee Extraction.” Journal of Agricultural and Food Chemistry, 62(21), 4947–4950. https://doi.org/10.1021/jf501687r
- European Coffee Brewing Centre (ECBC). (2006). Guidelines for the Preparation of Filter Coffee. Norwegian Coffee Association, Oslo, Norway.
- Salamanca, C. A., Feria-Morales, A., & Baquero, A. (2017). “Study of the Effect of Particle Size Distribution on the Extraction Efficiency of Coffee.” Food Science and Technology International, 23(8), 737–748.
- Wang, X., & Lim, L.-T. (2014). “Effect of Brewing Conditions on the Antioxidant Activity and Chemical Profile of Coffee Brews.” Journal of Food Science, 79(5), C490–C498.
- Kreuml, M. T. L., Majchrzak, D., Ploederl, B., & Koenig, J. (2013). “Changes in Sensory Quality Characteristics of Coffee during Storage.” Food Science and Nutrition, 1(4), 267–272. https://doi.org/10.1002/fsn3.35
- VST Inc. (2011). VST Coffee and Espresso Refractometer: User Guide and Technical Notes. VST Inc., Boston, MA.
- Hoffmann, J. (2014). The World Atlas of Coffee: From Beans to Brewing — Coffees Explored, Explained and Enjoyed. Mitchell Beazley, London.